






Written by Stanislav Sadovnikov, Founder, Magnum Estate ·
Reviewed by Magnum Estate legal & investment desk ·
Last updated 3 June 2026
"7-15% Gross yield (quoted, before costs) · 4-6% / 10-15% Net yield: self- vs pro-managed · ~65% Island occupancy (prime 70-85%) · 25-35% Cost drag on gross revenue"
Key figures (2026)
Bali villa ROI 2026: summary
Bali villa ROI is not a single headline percentage, it is the output of a simple calculation you can run yourself. The short answer: take quoted gross yield (7-15%), subtract every operating cost, and you land on the net yield you actually keep, roughly 4-6% self-managed or 10-15% professionally managed. Add capital appreciation of about 7-15% a year in strong areas for total ROI. That gap between the two net figures is almost entirely operations, not the headline rent: management fees, the 10% rental tax, maintenance and vacancy typically remove 25-35% of gross revenue. Payback period follows directly, roughly 20 years to recover capital at a 5% net return versus about 8 years at 12% net, which is why closing the gross-to-net gap matters more than chasing a higher advertised gross figure. Four levers decide the outcome: occupancy (island-wide ~65%, prime areas 70-85%), ADR (island-wide USD 90-98), cost drag, and appreciation.
- Gross yield = annual rent ÷ purchase price × 100 (a headline, before costs).
- Net yield = net annual income ÷ total invested capital × 100 (what reaches you).
- Payback period = total capital ÷ net annual income (~20 yrs at 5% net, ~8 yrs at 12%).
- The four net levers: occupancy, ADR, cost drag (fees + tax + maintenance + vacancy), and appreciation.
- Cost drag: management, the 10% rental tax, maintenance and vacancy typically remove 25-35% of gross.

"Transparency: Magnum Estate develops and manages property in Bali, so we have a commercial interest. This guide is educational, not investment or legal advice, verify figures independently and consult a certified Indonesian notary (PPAT) and tax advisor before buying."
Transparency
This Bali villa ROI guide is the mechanics manual: not which area to buy, but how to turn a price tag and a rent estimate into a return you can trust. Most disappointment comes from one error, judging a villa on a quoted gross yield instead of the net yield you actually keep. Below are the exact formulas, the four levers that decide net return, a fully worked example, and how to read payback period. For ROI ranked by area and budget, see our Bali villa investment ROI & locations guide.
Bali villa ROI: the formulas
Three calculations do almost all the work. Memorise these and you can sanity-check any brochure in under a minute:
| Metric | Formula | What it tells you |
|---|---|---|
| Gross yield | Annual rent ÷ purchase price × 100 | Headline only, ignores every cost |
| Net yield | Net annual income ÷ total invested capital × 100 | The cash you actually keep each year |
| Payback period | Total invested capital ÷ net annual income | Years to recover capital from rent alone |
| Total ROI | Net yield + annual capital appreciation | Cash flow plus price growth combined |
| “Total invested capital” includes purchase price plus acquisition costs (notary, taxes, furnishing). Net income deducts all operating costs (see below). |
The trap is the word “yield” with no qualifier. A villa advertised at “12% yield” is almost always quoting gross. The same villa, self-managed, can net 4-6% once costs are removed. Everything below is about closing, or understanding, that gap.
Gross vs net yield, what you keep
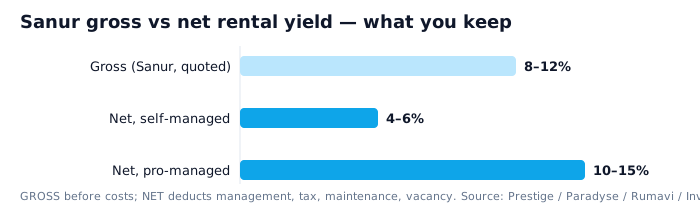
Most “8-15% yield” claims you will see for a Bali villa are gross, annual rent ÷ price, before costs. What you actually keep is the net yield, after management, tax, maintenance and vacancy. This single distinction is the biggest source of disappointed Bali investors, and the reason a “12% villa” can quietly become a 5% one:
| Metric | Typical range | What it means |
|---|---|---|
| Gross yield (quoted) | 7-15% | Annual rent ÷ purchase price, before any costs |
| Net yield, self-managed | 4-6% | After tax, maintenance, vacancy and owner time |
| Net yield, professionally managed | 10-15% | After fees, but with higher occupancy & ADR |
| Annual capital growth (strong areas) | ~7-15% | Like-for-like appreciation, added on top for total ROI |
| Gross and net are kept strictly separate. Net is what reaches your account. Source: Paradyse / Rumavi / InvestLandBali 2026. |
The gap between a 4-6% and a 10-15% net yield is almost entirely operations, data-driven pricing, OTA distribution and cost control, not the headline rent. The same building can sit at either end depending on how it is run. See how that plays out across areas in the ROI & locations hub. Closing that gap is precisely the job of professional property management in Bali.
What drives net ROI: occupancy, ADR, fees and tax
Net yield is decided by four levers. Get these right and a modest gross yield becomes a strong net one; ignore them and the reverse is true.
1. Occupancy
Island-wide occupancy averages around 65%, while prime, well-run villas in Canggu, Berawa and Uluwatu reach 70-85%. Sustained occupancy usually moves annual ROI more than chasing the highest nightly rate, a villa booked 75% of the year at a sensible price beats a “luxury-priced” villa that sits empty. High seasons (July, August, December, January) can push occupancy to 80-90%; shoulder and low seasons can drop short-term occupancy to 40-55% unless pricing and minimum-stay rules are adjusted.
2. ADR (average daily rate)
ADR is the second half of revenue. Bali island-wide ADR runs roughly USD 90-98, with prime Canggu and Uluwatu well above that. Gross revenue ≈ ADR × 365 × occupancy. Dynamic pricing that aligns rates to demand curves is reported to lift annual gross revenue by 8-15% on its own.
3. Cost drag (fees, tax, maintenance, vacancy)
This is where gross becomes net. Management and platform fees, utilities, cleaning and maintenance, insurance, marketing and the 10% accommodation/rental tax together typically remove 25-35% of gross revenue. Annual property tax (PBB) is low at about 0.1% of assessed value, but it still belongs in the model. The chart below shows where a typical short-term dollar goes:
4. Capital appreciation
Cash flow is only half of total ROI. Like-for-like prices in strong micro-markets have grown about 7-15% a year, and land appreciated roughly 15-30% over the past two years. Appreciation does not show up in net yield but is the larger part of total return over a 5-10-year hold.
The takeaway: the four levers compound. A villa at 70% occupancy, sensible ADR and professional management can land in the 10-15% net band; the same villa self-managed at 55% occupancy with heavy vacancy drag falls to 4-6%. To see how operations move the dial, read our
long-term vs short-term rental strategy
and weigh the holding costs in the taxes & holding costs guide.
See real net yields, not brochure gross
Magnum Estate publishes transparent pricing and projected net yields for its Berawa, Sanur and Uluwatu developments.
View Magnum projects
Book a free consultation
A worked Bali villa ROI example
Here is the full calculation for a representative USD 350,000 investor-grade villa, using island-average inputs (occupancy ~65%, ADR ~USD 95). The point is the method, not the exact dollar, swap in your own numbers.
| Line item | Self-managed | Professionally managed |
|---|---|---|
| Purchase + acquisition costs (total capital) | $365,000 | $365,000 |
| Occupancy | ~58% | ~75% |
| ADR (average daily rate) | $92 | $110 |
| Gross annual revenue | ~$19,500 | ~$30,100 |
| Gross yield (on purchase price) | ~5.6% | ~8.6% |
| Operating cost drag (incl. 10% tax) | ~32% | ~28% (after fees) |
| Net annual income | ~$13,300 | ~$21,700 |
| Net yield (on total capital) | ~3.6% | ~5.9% |
| Illustrative worked example at island-average inputs. Prime-area villas with 70-85% occupancy and higher ADR sit toward the top of the 4-6% / 10-15% net bands. Figures are estimates for method demonstration, not a forecast. ~IDR 16,000/USD. |
Two things stand out. First, the same building produces very different returns depending on how it is run. Second, the headline gross yield (5.6-8.6% here) is always higher than the net yield (3.6-5.9%), the difference is the cost drag, not magic. A prime-area villa with stronger occupancy and ADR pushes the professionally managed case into the 10-15% net band quoted earlier; an island-average, self-managed villa sits in the 4-6% band.
Payback period & total return
Payback period answers “how long until rent returns my capital?”, total invested capital ÷ net annual income. It deliberately ignores appreciation, so it is a conservative floor:
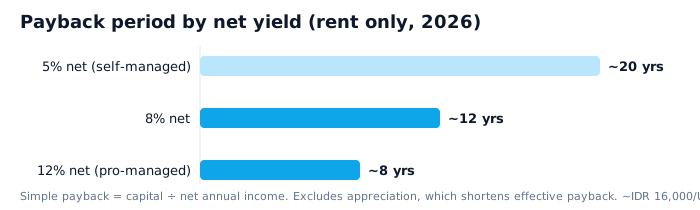
From rent alone, a 5% net yield repays capital in about 20 years, 8% in about 12 years, and 12% in roughly 8 years. But payback understates the real picture because it ignores price growth. Add 7-15% a year of appreciation and the effective recovery is far quicker, which is why total ROI (net yield + appreciation) is the number to plan around, not payback in isolation. For long-horizon NPV and IRR modelling over 10+ years, see our 10-year ROI investor guide.
Limitations & who this is not for
These are indicative ranges and illustrative maths, not a guaranteed return. Bali villa ROI is sensitive to assumptions: drop occupancy 10-15 points, raise costs 10%, or assume a flat appreciation year, and the picture changes materially, always stress-test before you buy. This approach suits investors who treat a villa as a managed business over a 5-10-year horizon. It is not for buyers seeking guaranteed yields, a 1-2-year flip (entry and exit costs erode short holds), or anyone relying on a single brochure gross number. Leasehold term, zoning, title and management quality can each swing the outcome more than the area you choose.
Methodology & sources
Figures are indicative 2026 ranges, reconciled across multiple market datasets and converted at ~IDR 16,000/USD. Gross yield is rent ÷ price before costs; net yield deducts management, tax, maintenance, utilities, insurance and vacancy from net annual income, divided by total invested capital. The worked example uses island-average inputs (occupancy ~65%, ADR ~USD 90-98) and is for method demonstration only. Always commission an independent appraisal and notary (PPAT) due diligence, and stress-test occupancy and cost assumptions, before purchase.
Conclusion
Bali villa ROI is a calculation, not a slogan. Start from gross, subtract the real cost drag to reach net, divide capital by net income for payback, then add appreciation for total return. Run that on your own inputs and you will never confuse a 12% gross headline with a 5% net reality again, and you will know exactly which lever (occupancy, ADR, fees or appreciation) to pull.
Ready to run the numbers on a real villa?
Explore Magnum Estate’s ocean-view residences in Uluwatu, Berawa and Sanur, transparent pricing and projected net yields you can plug straight into the formulas above.
Uluwatu, Sky Stars
Berawa
Sanur
FAQ: Bali villa ROI
How do you calculate Bali villa ROI?
Gross yield = annual rent ÷ purchase price × 100. Net yield = net annual income (rent minus management, tax, maintenance, utilities, insurance and vacancy) ÷ total invested capital × 100. Total ROI adds annual appreciation to net yield. Judge a villa on net, never gross.
What is a realistic net yield for a Bali villa in 2026?
About 4-6% if self-managed and 10-15% under professional management, after fees, tax, maintenance and vacancy. Quoted gross yields of 7-15% are before costs.
What is the payback period on a Bali villa?
Total capital ÷ net annual income. Roughly 20 years at 5% net, 12 years at 8%, and 8 years at 12%, before appreciation, which shortens it considerably.
What drives net ROI on a Bali villa?
Four levers: occupancy (island ~65%, prime 70-85%), ADR, cost drag (management, 10% tax, maintenance, vacancy), and capital appreciation. The 4-6% vs 10-15% gap is mostly operations.
Why is gross yield higher than net yield?
Gross ignores costs. Net deducts fees, the 10% rental tax, maintenance, utilities, insurance and vacancy, together 25-35% of gross, so a “gross 12%” villa can net 4-6% self-managed.
How does occupancy compare to ADR for ROI?
Both matter, but sustained occupancy usually moves annual ROI more than the highest nightly rate. A consistently booked villa at a sensible price beats a luxury-priced one that sits empty.
Should I include capital appreciation in ROI?
Yes, for total ROI. Net yield is cash flow; appreciation (~7-15%/yr in strong areas) is usually the larger part of return over a 5-10-year hold. Model both, separately.
References & official sources
- BPS, Statistics Indonesia / Bali: 2025 foreign arrivals (6,948,754, +9.72%), hotel/villa occupancy, bali.bps.go.id
- Bank Indonesia, Residential Property Price Index: official price-growth & IDR/USD data, bi.go.id
- DJP / Ministry of Finance: PBB (~0.1%) & the 10% accommodation/rental tax, pajak.go.id
- ATR/BPN: land titles, lease terms & zoning, atrbpn.go.id
- Market data (2026): Paradyse Homes price-per-are study; Prestige Property Bali area/yield analysis; InvestLandBali market report; Rumavi net-yield analysis; short-term-rental occupancy & ADR datasets (AirDNA-benchmarked).
- Magnum Estate portfolio data (net yields by project).
About the author
Stanislav Sadovnikov is the founder of Magnum Estate (PT Magnum Estate International), an award-winning full-cycle Bali real estate developer with 8 projects and 575 units since 2019 (Berawa, Sanur, Umalas, Sky Stars, Sky Royal). He writes about Bali pricing, yields, ownership rules and regulation for international buyers.