Written by Donny Yosua, Magnum Estate Analyst ·
Reviewed by Magnum Estate legal & investment desk ·
Last updated 3 June 2026
"6.95M 2025 foreign arrivals (+9.7%) · $250-1,900 Land per m² (emerging, Seminyak) · 12-18% Top gross yield (Canggu/Berawa) · 70-85% Prime-area occupancy"
Key figures (2026)
Bali property investment destinations 2026: summary
Bali property investment destinations, the short answer: the strongest areas in 2026 are Canggu/Berawa (deepest year-round rental demand), Uluwatu/Bukit
(ocean-view premium, fastest land appreciation), Seminyak (most liquid resale market),
Sanur and Ubud (defensive long-stay income) and the emerging belts
(Tabanan, Seseh, Cemagi, North Bali) for value and growth upside.
- Highest gross yield: Canggu/Berawa 12-18%, then Uluwatu/Bukit 10-16% (gross, before costs).
- Most expensive land: Seminyak/Umalas ($900-1,900/m²), central Canggu, Uluwatu, Ubud.
- Best resale liquidity: Seminyak, the most mature, established sub-market.
- Best value: emerging zones (Tabanan, Seseh, Cemagi, North Bali), most land per dollar.
- Gross ≠ net: net yields are ~4-6% self-managed, ~10-15% professionally managed.

"Transparency: Magnum Estate develops property in Bali, so we have a commercial interest. This roundup is educational, not investment or legal advice, verify figures independently and consult a certified Indonesian notary (PPAT) and tax advisor before buying."
Transparency
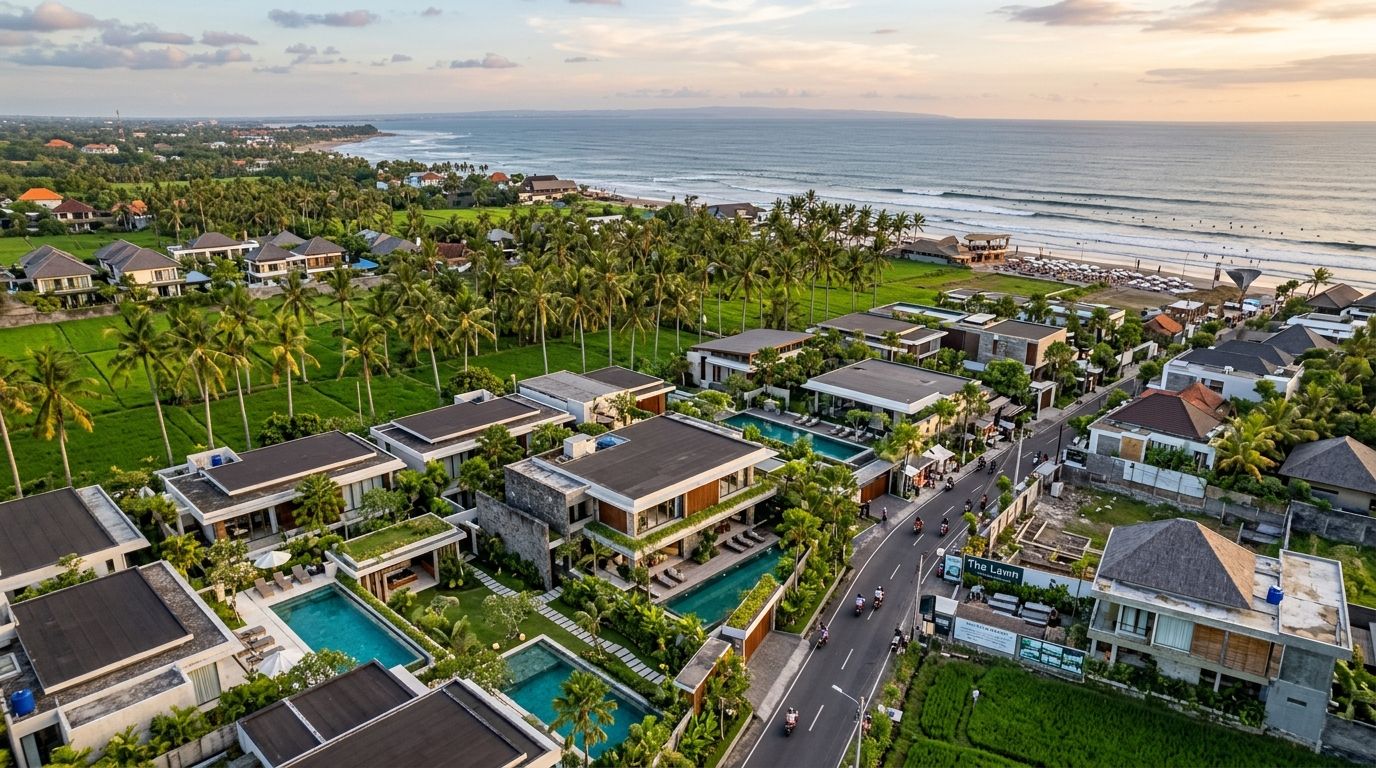
This guide ranks the best Bali property investment destinations for 2026, a concise, scannable index of the island’s leading areas, each linking out to a deeper area guide. Bali drew about 6.95 million foreign visitors in 2025 (+9.7% YoY), surpassing pre-pandemic records, but demand is now selective: the right destination matters far more than it did during the post-pandemic boom. Below, every area is ranked on the same three axes, land price per m², gross yield and rental demand, so you can compare apples to apples before reading the full deep-dives.
Why Bali is a top property investment destination in 2026
Three forces line up in the same direction: rising tourism, deep rental demand and long-term capital growth. Bali received roughly 6.95 million foreign arrivals in 2025, up ~9.7% year-on-year (BPS Bali), pushing prime-area occupancy to 70-85% (island-wide nearer ~65%). Land values appreciated about 15-30% over the past two years, with like-for-like price growth around 7-15% a year in strong micro-markets. The market has matured from speculation into a data-driven phase, which is precisely why destination selection now decides returns. For the underlying price map, see our Bali property prices 2026 guide; for the full ranked pillar, see best areas to buy property in Bali 2026.
Bali property investment destinations at a glance
The fastest way to compare destinations is on one table. Land prices are per m² (converted from per-are at ~IDR 16,000/USD); yields are gross (before costs), net is covered separately below.
| Destination | Land per m² | Gross yield | Best for |
|---|---|---|---|
| Canggu / Berawa | ~$530-1,560 | 12-18% | Cash flow, year-round demand |
| Uluwatu / Bukit | ~$310-940 | 10-16% | Capital growth, luxury ADR |
| Seminyak / Umalas | ~$900-1,900 | 10-14% | Resale liquidity, prestige |
| Sanur | ~$310-940 | 10-15% | Defensive, long-stay income |
| Ubud | ~$250-750 | 10-15% | Wellness & long-stay; low volatility |
| Emerging (Tabanan, Seseh, Cemagi, N. Bali) | < $250 | 6-18% | Value & growth upside |
| Land per m²: Paradyse Homes 2026 (per-are, AirDNA-benchmarked) & COCO 2026. Gross yield: Prestige Property Bali 2026. Sanur land is mapped to the Bukit/Uluwatu band as a mid-priced southern coastal zone. ~IDR 16,000/USD. |
Land price per m² by destination

Land is the cleanest single comparator across destinations because it strips out build quality and product type. The ranking is consistent and monotonic, prime central zones cost the most, emerging belts the least. For the same budget you secure far more land in Uluwatu, Sanur or Ubud than in Seminyak or central Canggu; the trade-off is the maturity of short-stay rental demand, not just scenery.
The takeaway: the two southern coasts behave very differently, Canggu trades on cash-flow density, Uluwatu on view-driven appreciation. We break the choice down in Canggu vs Uluwatu, and the full ranked shortlist lives in best areas to buy property in Bali 2026.
Gross yield by destination: read it before you commit

Almost every “yield” or “ROI” figure quoted for Bali destinations is gross, annual rent ÷ price, before costs. What you keep is the net yield, after management, tax, maintenance and vacancy. This is the single biggest source of disappointed Bali investors, and it applies equally across every destination:

The gap between 4-6% and 10-15% net is operations, not destination: data-driven pricing, OTA distribution and cost control. Model holding costs with our taxes & holding costs guide and see how management drives the net number in our villa ROI guide.
Area profiles: who each destination suits
Canggu & Berawa, the cash-flow core
Canggu and its Berawa pocket remain Bali’s deepest, most reliable rental market: a global hub for remote workers and lifestyle travellers, with year-round occupancy and the highest gross yields on the island (12-18%). Land is supply-constrained and appreciating fast (~$530-1,560/m²). This is the destination for investors who prioritise consistent cash flow over a trophy view. See Magnum’s Berawa development for live pricing in the zone.
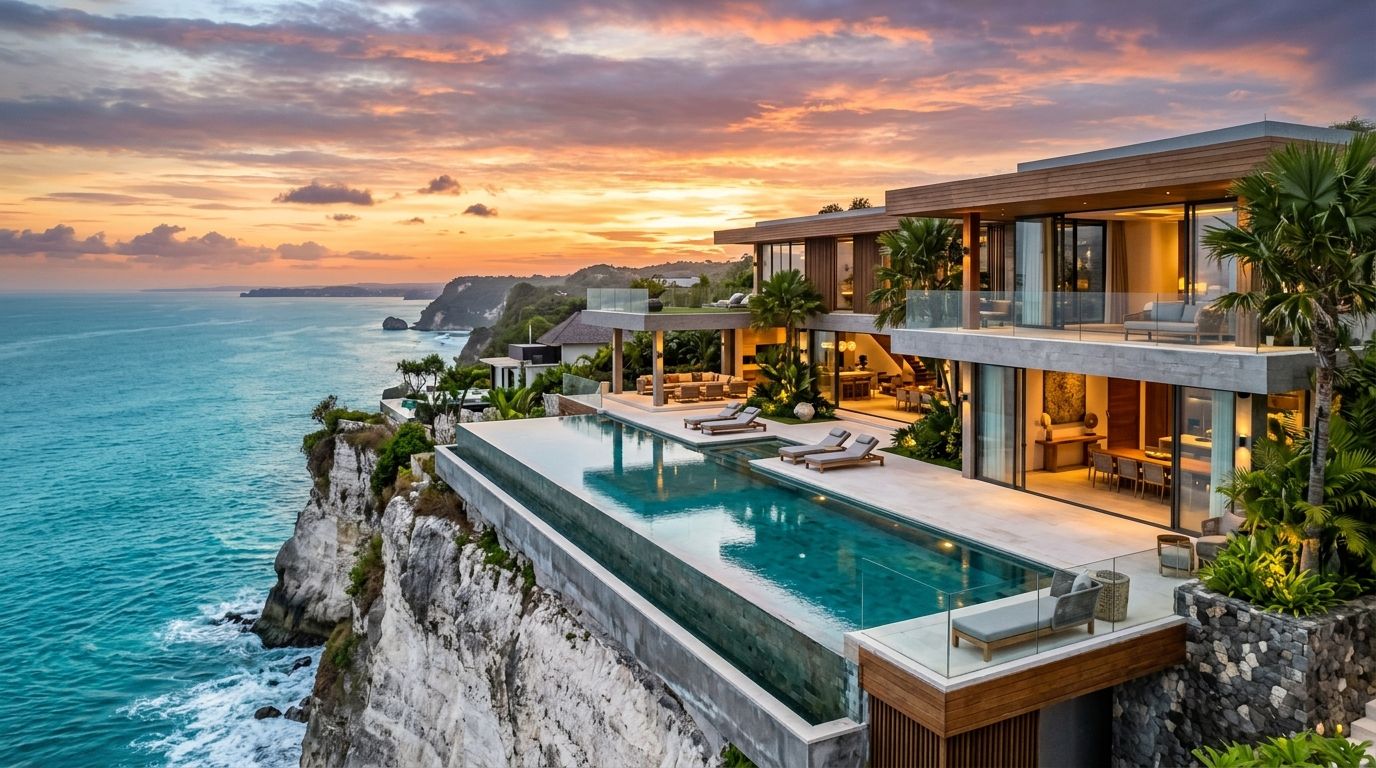
Uluwatu & the Bukit Peninsula, the view-driven growth engine
The Bukit (Uluwatu, Bingin, Padang-Padang) is Bali’s capital-growth leader: cliff-top scenery, world-class surf, new infrastructure and genuinely limited buildable land. Gross yields run 10-16%, luxury ADRs are the island’s highest, and land ($310-940/m²) has appreciated faster than anywhere else. Best for investors targeting appreciation plus premium lifestyle. Explore Magnum’s Uluwatu residences at Sky Stars, and weigh it against Canggu in Canggu vs Uluwatu.
Seminyak & Petitenget, the liquid, mature market
Seminyak is the island’s most established sub-market: beach-adjacent, central, amenity-rich, with the highest land prices ($900-1,900/m²) and slightly lower gross yields (10-14%). What it offers instead is resale liquidity, the easiest exit on the island, which matters more than headline yield for many investors planning a defined hold period.
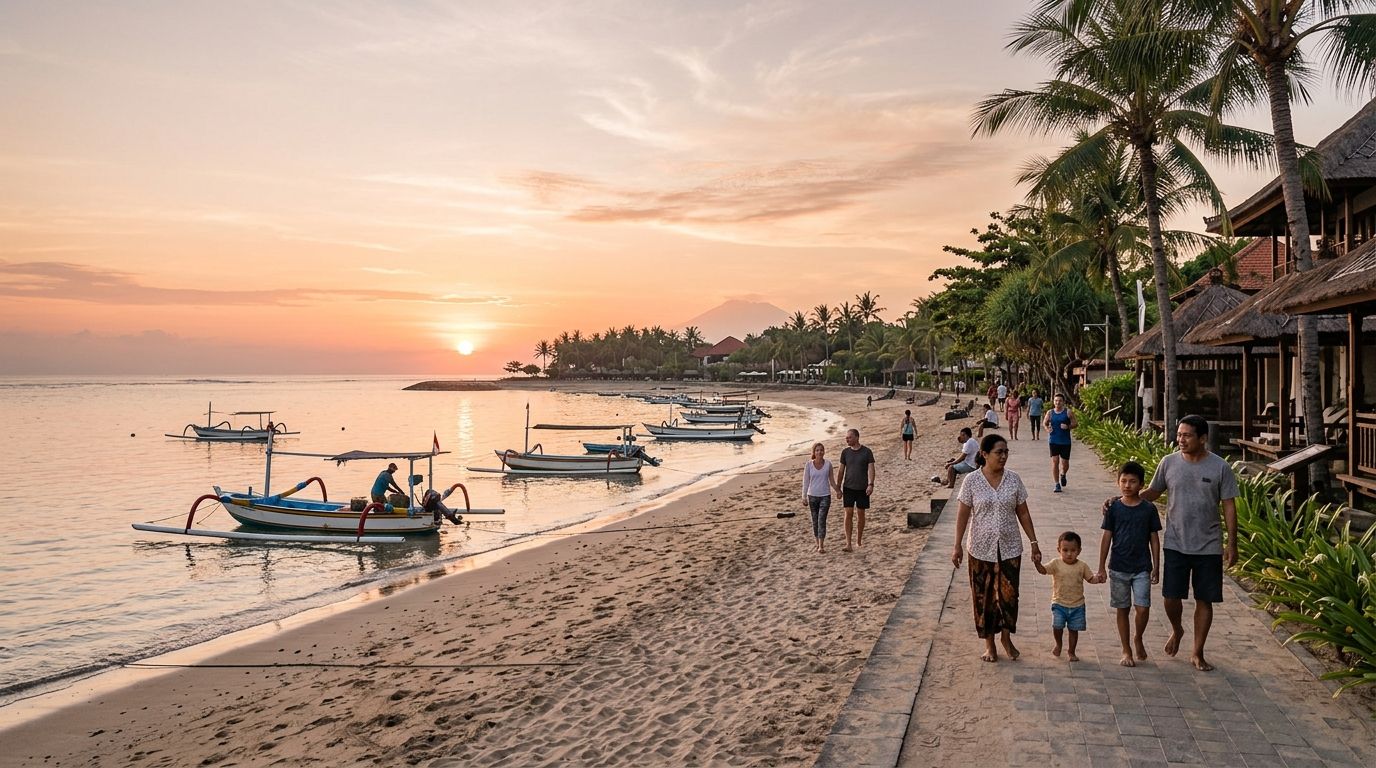
Sanur, the defensive, long-stay destination
Sanur trades on stability rather than hype: a calmer, family- and wellness-oriented east-coast town with durable long-stay demand and gross yields around 10-15%. Mid-priced land and a steadier tenant base make it a defensive anchor in a portfolio. See Magnum’s Sanur project and the detailed case in our Sanur area guide.
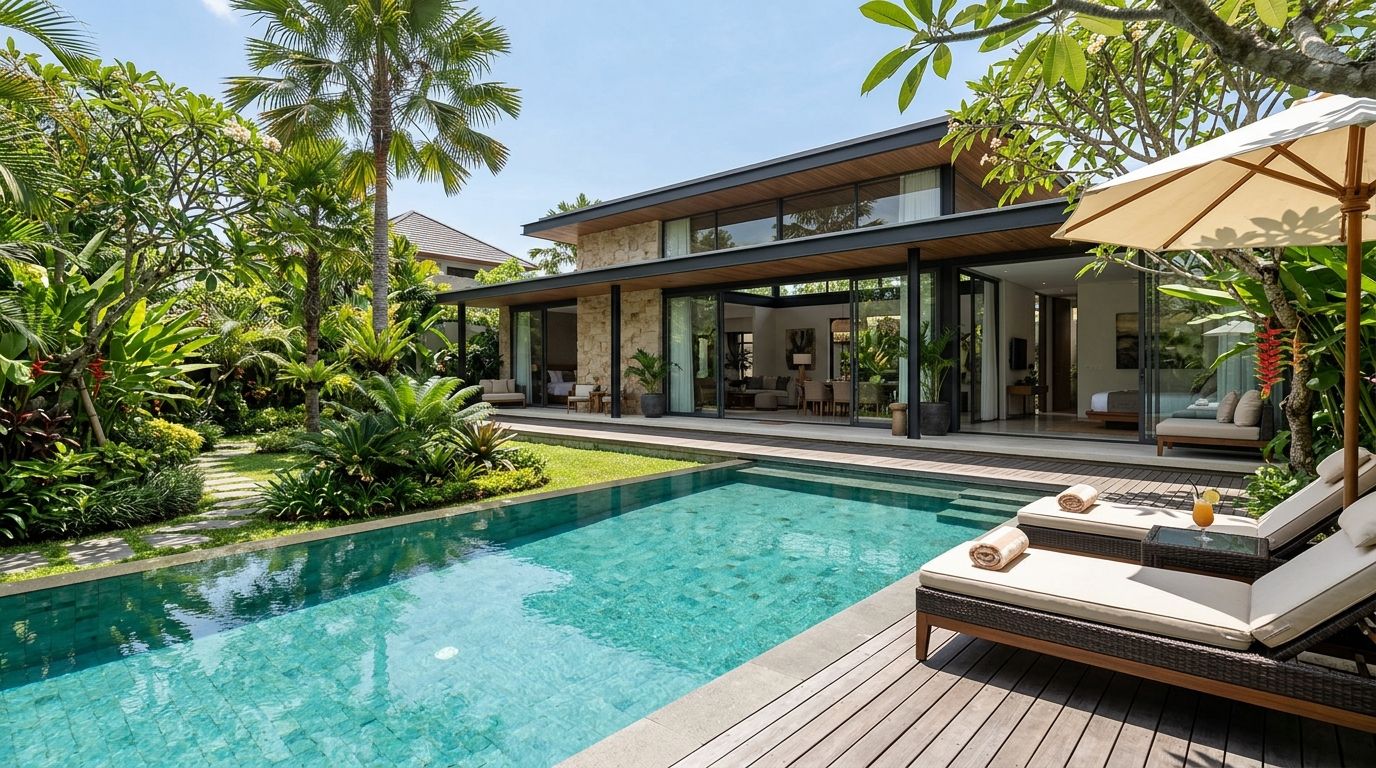
Ubud, wellness & low volatility
Inland Ubud is the wellness and long-stay play: jungle and rice-field settings, lower density, the cheapest prime-ish land ($250-750/m²) and gross yields of 10-15% with low volatility. It suits investors who want experiential, nature-integrated product rather than beach-club footfall.
Emerging belts, Tabanan, Seseh, Cemagi & North Bali
The emerging belts deliver the most land per dollar (under $250/m²) and the widest yield range (6-18% depending on micro-location), in exchange for a longer demand-building horizon. These are growth-upside positions best paired with a proven hotspot. The deep dive lives in our Bukit area guide and the best-areas pillar.
See real numbers for each destination
Compare live pricing and projected net yields across Magnum Estate’s Berawa, Sanur and Uluwatu developments.
View Magnum projects
Book a free consultation
How to choose between Bali property investment destinations
Match the destination to your objective rather than chasing the highest headline number:
| Your priority | Best-fit destination(s) | Why |
|---|---|---|
| Maximum cash flow | Canggu / Berawa | Highest gross yield, deepest year-round demand |
| Capital growth + luxury ADR | Uluwatu / Bukit | Fastest land appreciation, premium views |
| Easy exit / resale | Seminyak | Most mature, most liquid sub-market |
| Defensive, steady income | Sanur / Ubud | Long-stay & wellness demand, low volatility |
| Value & upside | Emerging belts | Most land per dollar, growth horizon |
| A common 2026 strategy pairs one proven hotspot (Canggu, Uluwatu, Seminyak) with one emerging-zone position for growth. |
Limitations & suitability
These destinations are not equally suited to every investor. Emerging belts can sit with thin rental demand for years and are unsuitable if you need income from day one. Prime zones (Seminyak, central Canggu) carry the highest entry cost and the lowest gross yields, so they reward exit-liquidity buyers more than yield-hunters. Every destination is exposed to regulation, congestion and zoning tension; regulators are responding with infrastructure upgrades and stricter compliance, which rewards legal, well-located assets and punishes poorly structured ones. None of these ranges substitute for parcel-level due diligence, an independent appraisal and notary (PPAT) title checks. Bali is best modelled as a 5-10-year lifestyle + investment horizon, not a short-term flip.
Methodology & sources
Figures are indicative 2026 ranges, reconciled across multiple market datasets and converted at ~IDR 16,000/USD. Land prices are stated per m² (from per-are data, 1 are = 100 m²). Gross yields are rent ÷ price before costs; net yields deduct management, tax, maintenance and vacancy and are stated once, island-wide, to avoid implying false precision per destination. Sanur land is mapped to the mid-priced southern coastal band. Individual parcels vary by road access, zoning, view and lease term, always commission an independent appraisal and notary (PPAT) due diligence before purchase.
Conclusion
The best Bali property investment destinations in 2026 are not a single answer but a shortlist matched to intent: Canggu/Berawa for cash flow, Uluwatu/Bukit for growth, Seminyak for liquidity, Sanur/Ubud for defensive income, and the emerging belts for value. Rank any candidate on the same three axes, land price per m², realistic net yield, and demand depth, and verify title before you commit.
Ready to compare destinations with real numbers?
Explore Magnum Estate’s ocean-view residences in Uluwatu, Berawa and Sanur, transparent pricing and projected net yields.
Uluwatu, Sky Stars
Berawa
Sanur
FAQ: Bali property investment destinations 2026
What are the best Bali property investment destinations in 2026?
Canggu/Berawa (cash flow), Uluwatu/Bukit (growth and luxury ADR), Seminyak (resale liquidity), Sanur and Ubud (defensive long-stay income), and emerging belts (Tabanan, Seseh, Cemagi, North Bali) for value and upside.
Which Bali destination has the highest rental yield?
Canggu/Berawa leads on gross yield at ~12-18%, then Uluwatu/Bukit 10-16%, Ubud/Sanur 10-15%, Seminyak 10-14% and North Bali 6-10%. These are gross; net is ~4-6% self-managed or ~10-15% professionally managed.
Which destination is most expensive to buy in?
Seminyak/Umalas has the highest land price per m² (~$900-1,900), then central Canggu (~$530-1,560). Uluwatu carries the highest ocean-view premium and the fastest land appreciation.
Where is the best value among Bali investment destinations?
Emerging belts, Tabanan, Seseh, Cemagi and North Bali (Lovina), with land below $250/m² and villas from ~$100,000-600,000, in exchange for a longer demand horizon.
How do I choose between destinations?
Match destination to goal: cash flow (Canggu/Berawa), growth (Uluwatu/Bukit), exit liquidity (Seminyak), defensive income (Sanur/Ubud) or value (emerging). Always check land per m², realistic net yield and clean title.
Is Bali a short-term flip or a long-term destination?
Long-term. Brand loyalty, revisit intention and a shift toward higher-quality, sustainable tourism support a 5-10-year lifestyle + investment horizon rather than a speculative flip.
Are there risks investors should weigh?
Yes, congestion, zoning tension and tighter compliance. These reward legal, well-located, professionally managed assets and penalise poorly structured ones.
References & official sources
- BPS, Statistics Indonesia / Bali: 2025 foreign arrivals (~6.95M, +9.7%), occupancy, bali.bps.go.id
- Bank Indonesia, Residential Property Price Index: official price-growth data & IDR/USD, bi.go.id
- DJP / Ministry of Finance: PBB & transaction taxes, pajak.go.id
- ATR/BPN: land titles & zoning, atrbpn.go.id
- Market data (2026): Paradyse Homes price-per-are study (AirDNA-benchmarked); Prestige Property Bali area/yield analysis; Bali Villa Realty price guide; InvestLandBali market report; COCO 2026 land study.
- Magnum Estate portfolio data (net yields by project): based on [N] units, [period]. [add methodology]
About the author
Donny Yosua is a market analyst at Magnum Estate, an award-winning Bali developer (Berawa, Sanur, Sky Stars, Sky Royal). He tracks Bali pricing, yields and regulation for foreign investors.