Written by Donny Yosua, Magnum Estate Analyst ·
Reviewed by Magnum Estate legal & investment desk ·
Last updated 3 June 2026
"$310-940 Uluwatu/Bukit land per m² · 10-16% Gross yield (Uluwatu/Bukit) · 4-6% / 10-15% Net yield: self vs pro-managed · +15-30% Land appreciation / 2 yrs"
Key figures (2026)
Uluwatu bukit roi strategy 2026: summary
The right uluwatu bukit roi strategy for 2026 buys land scarcity first and rental cash flow second. Underwrite a gross yield of 10-16% on an ocean-view position, but plan on a net yield of just 4-6% self-managed, or 10-15% under professional management. Most of your total return comes from land appreciation (~15-30% over two years), not the headline yield.
- Entry points: cliff-front (scarce, highest ADR, highest cost) vs second-row Ungasan/Pecatu (cheaper land per m², still ocean views).
- Pricing: leasehold 2-4BR from $120-300k; ocean-view 3BR $500-900k; land $310-940/m².
- Operations: ADR often $280-420+, occupancy 60-75%; management decides whether you keep 4-6% or 10-15% net.
- Gross ≠ net: “13-18% ROI” claims you see are gross, net is materially lower after costs.
- Thesis: you cannot create more clifftop; scarcity + luxury tourism underpin the appreciation case.

"Transparency: Magnum Estate develops property in Bali (including the Uluwatu-area Sky Stars residence), so we have a commercial interest. This guide is educational, not investment or legal advice, verify figures independently and consult a certified Indonesian notary (PPAT) and tax advisor before buying."
Transparency
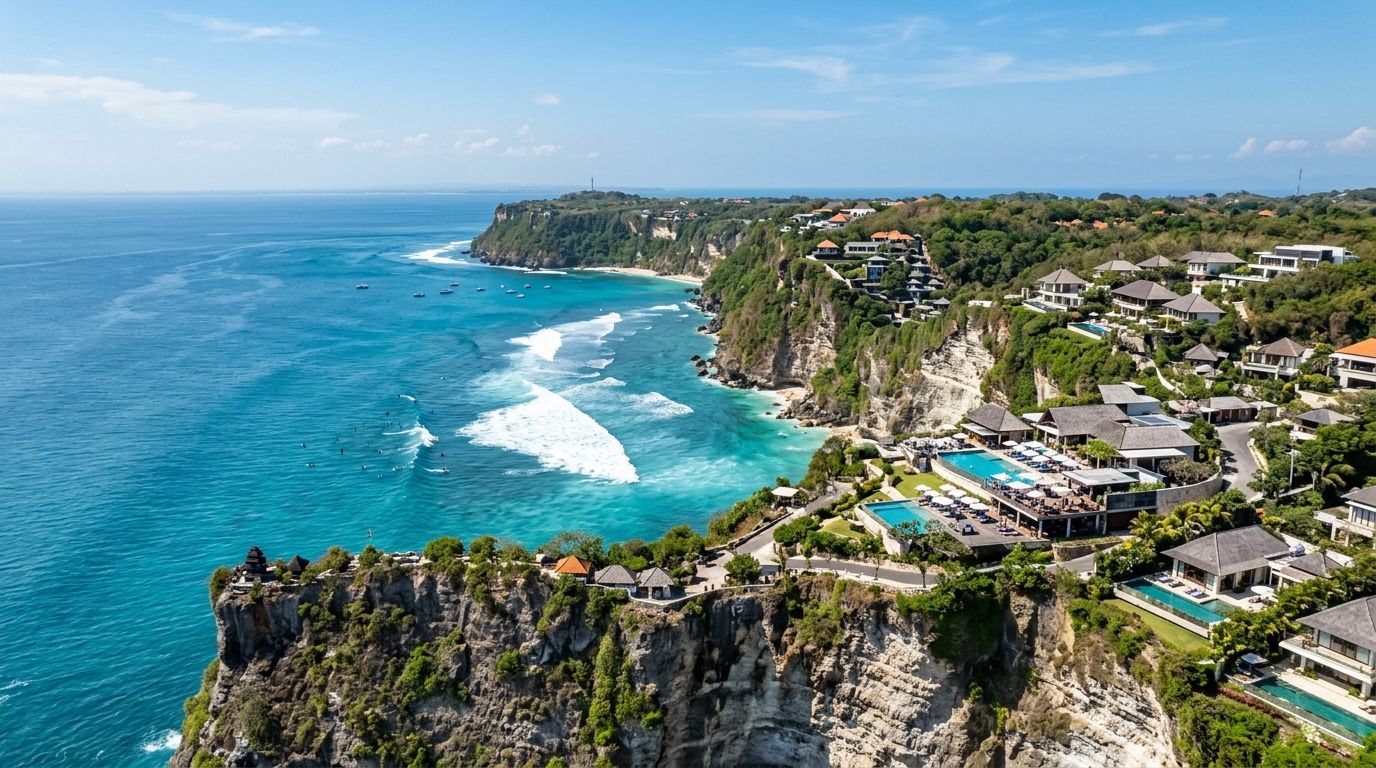
This uluwatu bukit roi strategy guide turns the area’s reputation for “serious ROI” into numbers you can underwrite. The Bukit peninsula has shifted from a quiet surf escape into one of Bali’s most strategic zones precisely because land scarcity is real, you cannot manufacture more clifftop. But the gap between the gross yields advertised and the net you actually keep is the single biggest source of disappointed Uluwatu investors. Below is the entry-point decision, the operating reality, and the payback and appreciation maths, on reconciled 2026 data (~IDR 16,000/USD).
Why Uluwatu/Bukit, and what this strategy actually is
The Bukit peninsula carries Bali’s highest ocean-view premium and its fastest land appreciation. Island-wide, land values rose roughly 15-30% over the past two years, and high-end demand is concentrating in South Bali on the back of rising luxury tourism, stricter zoning and a shrinking stock of premium coastline. A sound uluwatu bukit roi strategy therefore treats the villa as two assets in one: a rental-income business and a scarce land position. The mistake is buying the headline yield while ignoring which of those two engines is really driving the return.
For the wider price map across the island, see our Bali property prices 2026 guide; for how the two southern coasts trade off, compare Canggu vs Uluwatu.
Entry points: cliff-front vs second-row (Ungasan / Pecatu)

The first strategic fork is where on the peninsula you buy. Land in Uluwatu/Bukit spans a broad $310-940/m² precisely because a cliff-front parcel and a second-row plot in Ungasan or Pecatu are different products. Don’t buy “Uluwatu” on the map, buy a proven micro-pocket (Bingin, Padang Padang, Pecatu, Ungasan, Nyang-Nyang) where surf, dining, beach access and roads already support premium rates.
| Entry point | Indicative price | Land $/m² | Strategic profile |
|---|---|---|---|
| Cliff-front / trophy estate | $900k, multi-million | ~$700-940 (toward top of range) | Maximum scarcity, highest ADR & resale; high build/engineering & ops demands |
| Ocean-view 3BR (first/second row) | $500-900k | ~$450-700 | Core investor product; strong ADR if design & positioning are right |
| Second-row (Ungasan / Pecatu) | $300-600k | ~$310-500 | Lower land cost per m²; often the most efficient ROI per dollar |
| Leasehold 2-4BR (Bingin / Balangan) | $120-300k+ | n/a (leasehold) | Lowest entry; surfer/nomad demand; check remaining lease term |
| Built, leasehold/freehold mix. Land per m² from canonical Bali 2026 data (Paradyse Homes per-are, AirDNA-benchmarked; COCO 2026), ~IDR 16,000/USD. Ocean-view 3BR band per Bali Villa Realty / Prestige 2026. |
The takeaway: cliff-front maximises scarcity and ADR but loads up entry cost and operating complexity; a second-row Ungasan/Pecatu position buys cheaper land per m² while still capturing ocean views, frequently the more efficient return per dollar. Pressure-test the trade-off against buying a villa in Bukit, Bali and the area comparison in Canggu vs Uluwatu.
ADR, occupancy & the gross-vs-net gap

Uluwatu earns its reputation on the top line: ADR is often USD 280-420+ (and well above that for prime clifftop product), with occupancy of 60-75%. That supports a gross yield of 10-16%, the figure most “13-18% ROI” headlines actually describe. But gross is rent ÷ price before costs. What you keep is the net yield, after management, tax, maintenance and vacancy:

On a top-tier Uluwatu villa, operating costs can run to roughly 52-55% of revenue, which is why a self-managed owner often lands at a 4-6% net yield while a professionally managed, resort-style operation reaches 10-15% net. That gap, typically a 3-5% ROI uplift from integrated management, is the operational core of any credible uluwatu bukit roi strategy.
The difference between 4-6% and 10-15% net is operations: data-driven pricing, OTA distribution and cost control. Model holding costs with our taxes & holding-costs guide, and see the full return mechanics in our villa ROI guide.
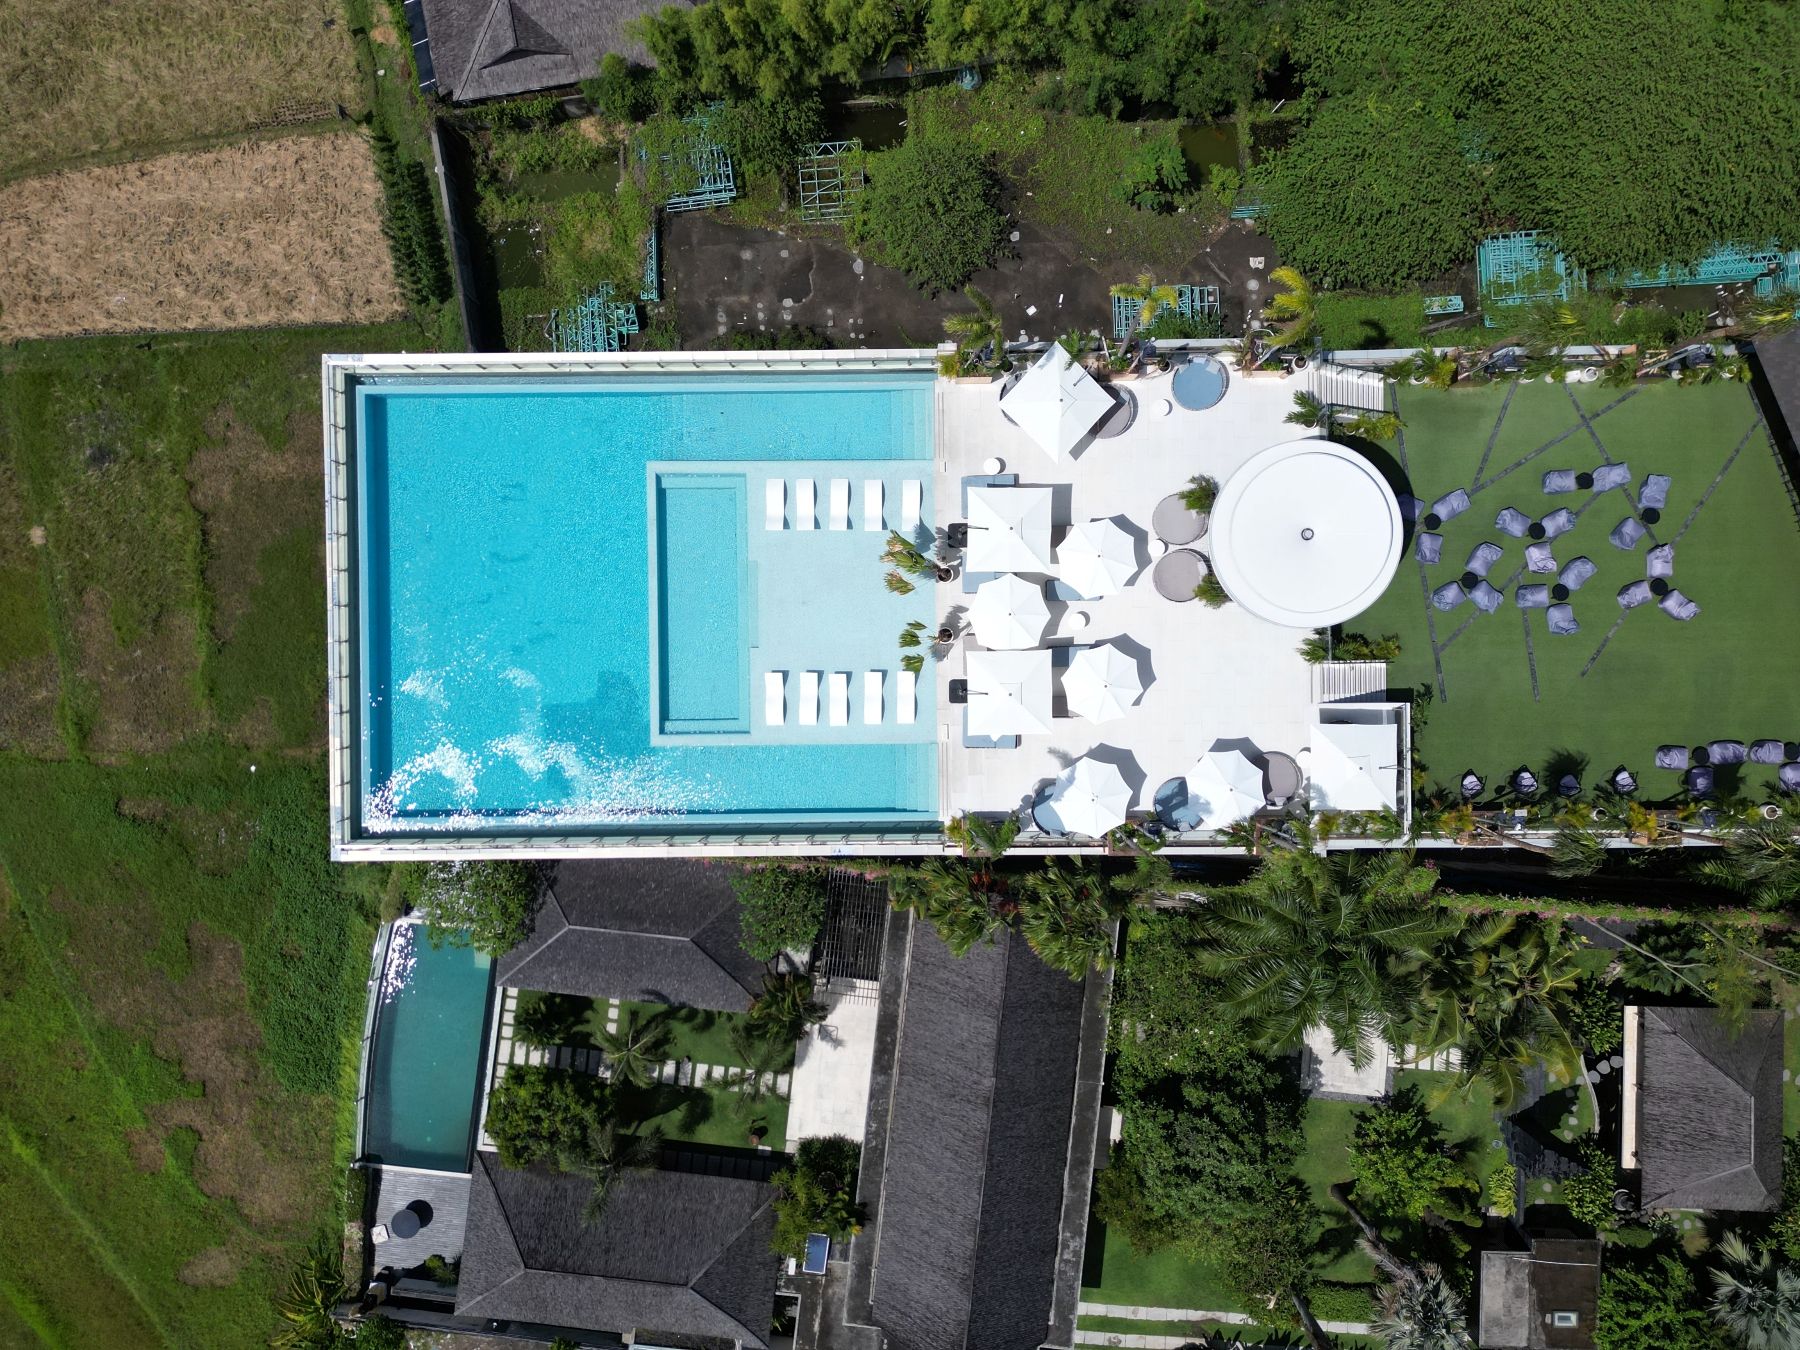
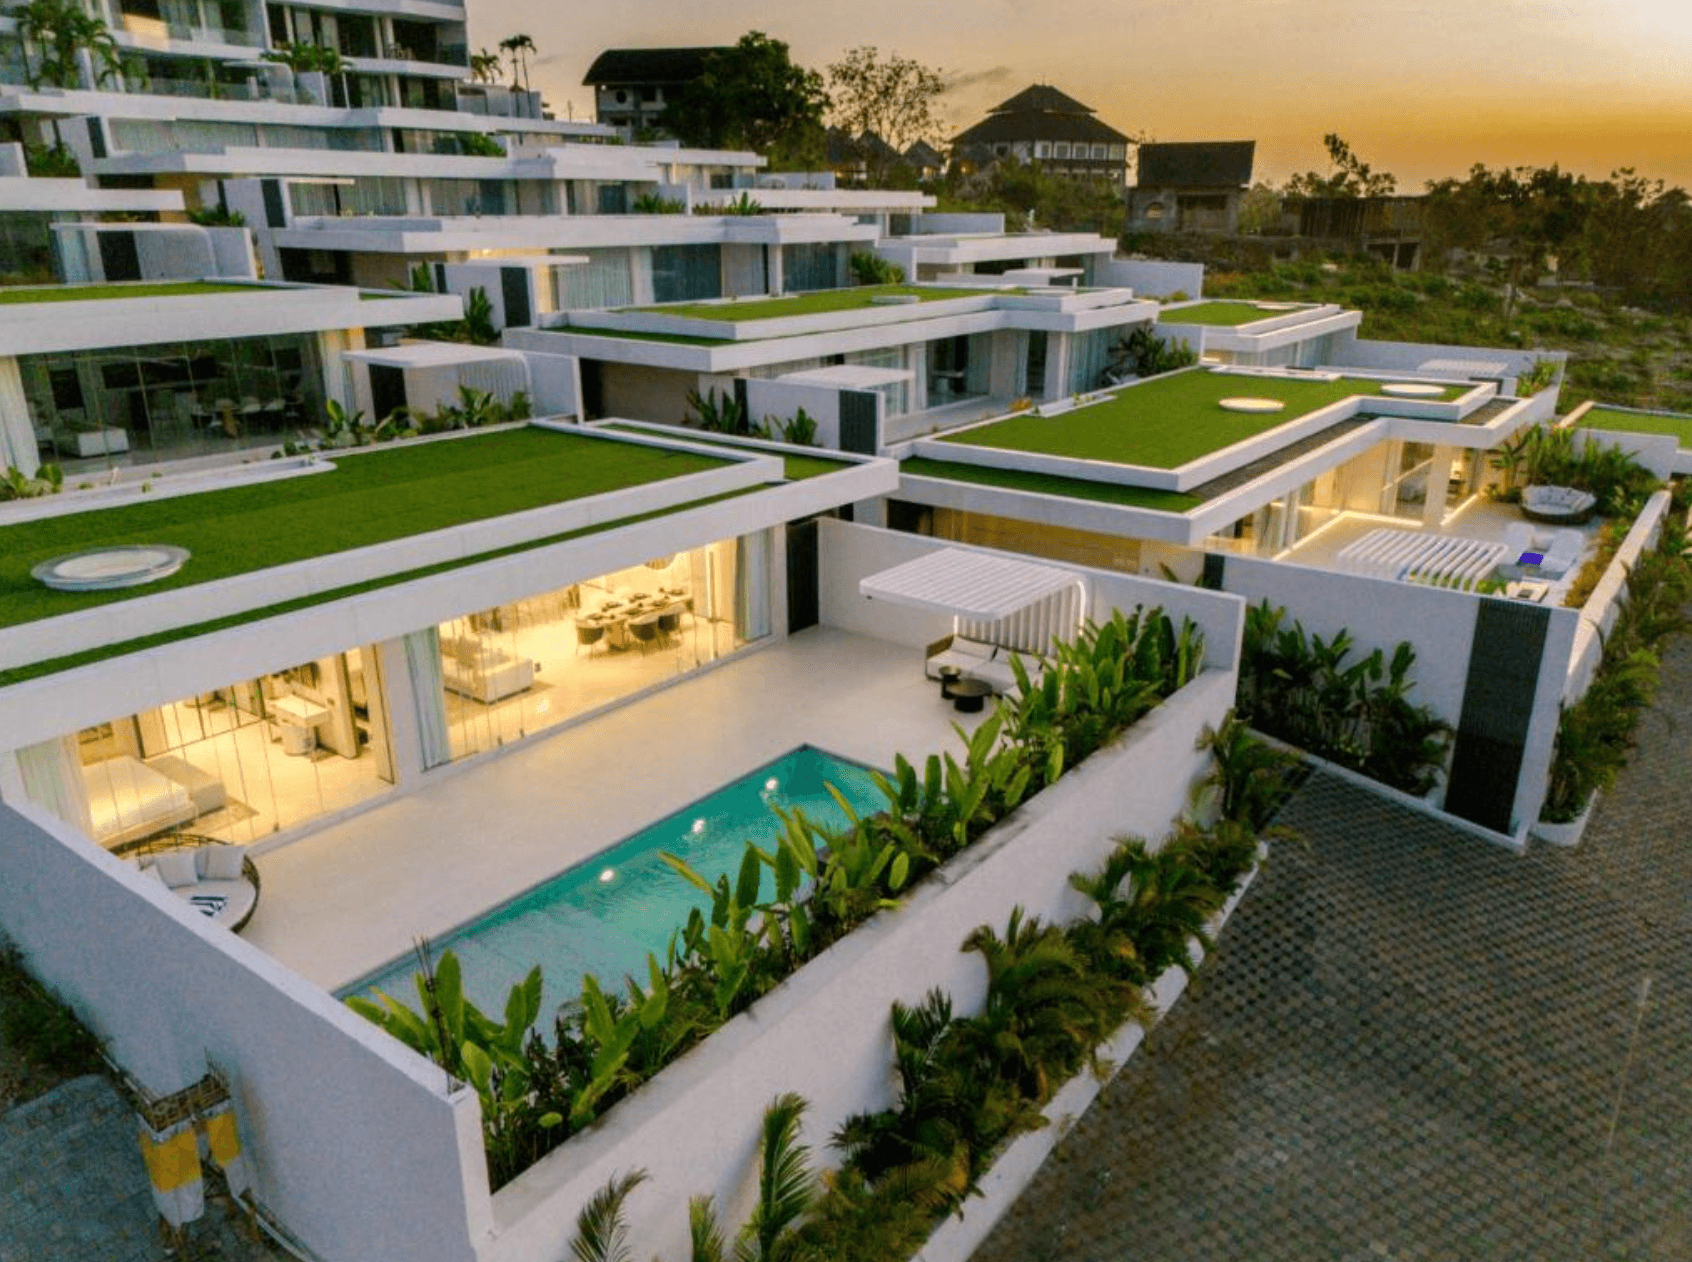
See real Uluwatu numbers, not averages
Compare live pricing and projected net yields at Magnum Estate’s Uluwatu-area Sky Stars residence.
Uluwatu, Sky Stars
Book a free consultation
Payback & the appreciation thesis
Treat clifftop as development, not speculation: model pessimistic, base and optimistic cases for occupancy, ADR and costs before committing. On rental cash flow alone, a 10-15% net yield implies a rough 7-10 year payback; at a self-managed 4-6% net it is far longer. That is why, in Uluwatu, the larger half of total return is the land: with appreciation of ~15-30% over two years and like-for-like price growth around 7-15% a year in strong micro-markets, the scarce position does heavier lifting than the rent.
| Scenario (ocean-view 3BR, illustrative) | Net yield | Rough cash-flow payback | Total-return driver |
|---|---|---|---|
| Self-managed | 4-6% | ~17-25 yrs | Appreciation dominates; rent thin |
| Professionally managed | 10-15% | ~7-10 yrs | Balanced rent + appreciation |
| Illustrative payback = 1 ÷ net yield, before appreciation and financing. Net yields per canonical Bali 2026 data (Paradyse / Rumavi / InvestLandBali). Appreciation ~15-30%/2yrs (BPS Bali / Prestige 2026). Not a forecast. |
Structure first: foreigners cannot hold Hak Milik (freehold) directly, use Leasehold (Hak Sewa) or a PT PMA holding HGB, and verify zoning and remaining lease before you underwrite any return. Start with our foreigner’s legal guide to buying in Bali, and decide structure with our data-not-hype investing guide.
Limitations & who this is not for
This strategy is not for hands-off owners chasing the advertised 13-18% number: those figures are gross, and a self-managed Uluwatu villa realistically nets 4-6%. It is also not ideal for short horizons, payback and the appreciation thesis both assume you hold through the cycle. Cliff-front product adds engineering, access and wind exposure that a spreadsheet won’t show; a 500-metre difference in position can materially change access, noise and resale appeal. Leasehold buyers must price the declining lease into exit value. If you want deeper, year-round rental demand with lower entry complexity, Berawa/Canggu may suit better, see Canggu vs Uluwatu.
Conclusion
A disciplined uluwatu bukit roi strategy for 2026 reads like this: pick a proven micro-pocket; decide cliff-front (scarcity, top ADR, top cost) versus second-row Ungasan/Pecatu (cheaper land, more efficient ROI per dollar); underwrite gross 10-16% but budget net at 4-6% self-managed or 10-15% professionally managed; and let scarce land, appreciating ~15-30% over two years, carry the total return.
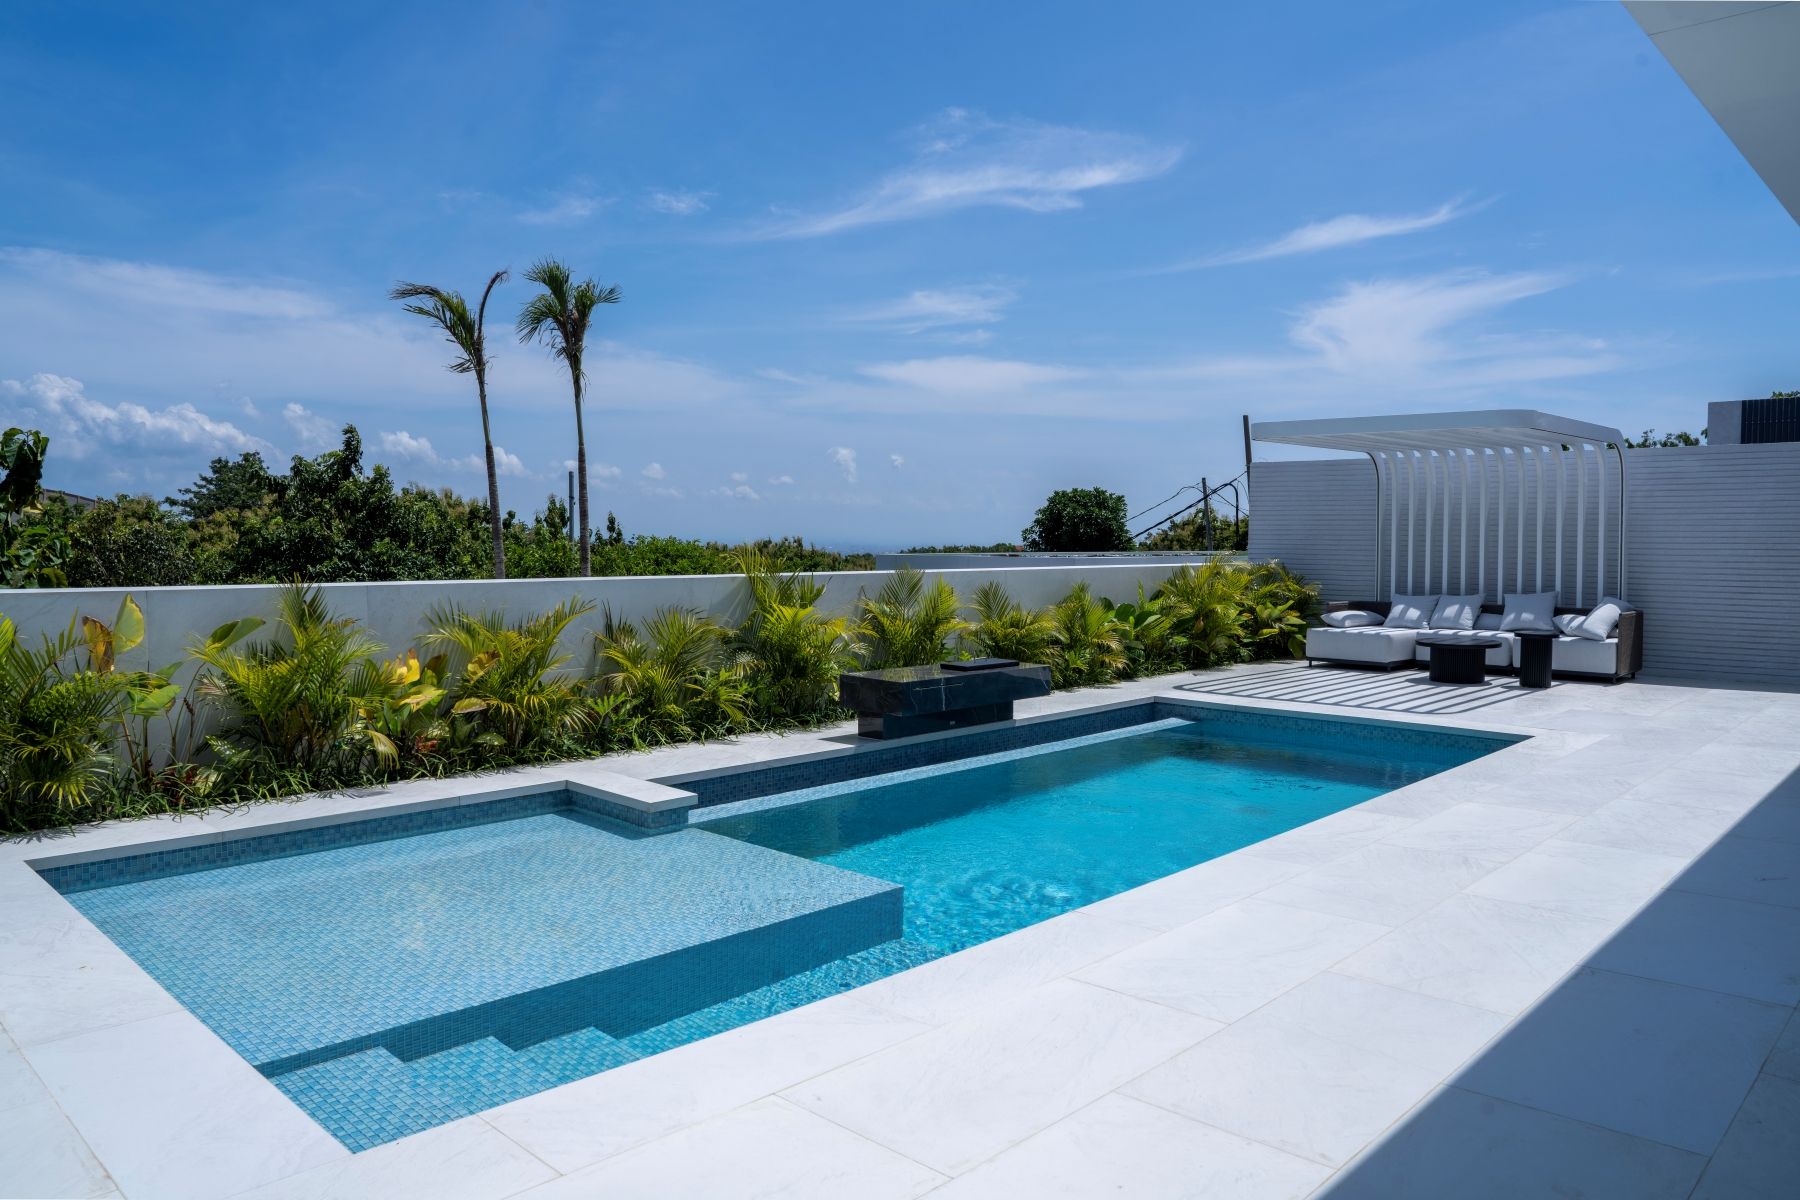
Ready to underwrite a real Uluwatu position?
Explore Magnum Estate’s ocean-view residences in Uluwatu, Berawa and Sanur, transparent pricing and projected net yields.
Uluwatu, Sky Stars
Berawa
Sanur
FAQ: Uluwatu bukit roi strategy 2026
What is a realistic Uluwatu bukit roi strategy for 2026?
Buy on land scarcity, not headline yield: secure a clifftop or second-row ocean-view position in a proven micro-pocket, underwrite gross 10-16%, and assume net of only 4-6% self-managed or 10-15% professionally managed. Total return is split between rent and ~15-30% land appreciation over two years.
How much do Uluwatu / Bukit villas cost in 2026?
Leasehold 2-4BR villas in Bingin or Balangan start ~$120-300k; an ocean-view 3BR runs ~$500-900k; land is ~$310-940/m². Trophy clifftop estates reach multi-million-dollar valuations.
What yield can I expect on an Uluwatu villa?
Gross runs ~10-16%. Net is lower: ~4-6% self-managed or ~10-15% professionally managed, after costs. ADR is often $280-420+ with 60-75% occupancy.
Cliff-front or second-row, which is the better entry point?
Cliff-front maximises scarcity, ADR and resale but costs more and is operationally heavier. Second-row Ungasan/Pecatu lowers land cost per m² while still capturing ocean views, often delivering more efficient ROI per dollar.
How long is the payback on an Uluwatu villa?
At 10-15% net (pro-managed), rental cash flow alone implies ~7-10 years before appreciation; at 4-6% self-managed it is far longer. Appreciation of ~15-30% over two years is the larger return driver here.
Is professional management really worth it?
Yes, it typically adds a 3-5% ROI uplift and is what separates a 4-6% self-managed net from a 10-15% pro-managed net on the same asset.
Methodology & sources
Figures are indicative 2026 ranges, reconciled across multiple market datasets and converted at ~IDR 16,000/USD. Land is stated per m² (from per-are data, 1 are = 100 m²). Gross yields are rent ÷ price before costs; net yields deduct management, tax, maintenance and vacancy. Area yield percentages (10-16% for Uluwatu/Bukit) are gross; “13-18% ROI” claims circulating for the area are gross, not net. Payback figures are illustrative (1 ÷ net yield), before appreciation and financing. Always commission an independent appraisal and notary (PPAT) due diligence before purchase.
References & official sources
- BPS, Statistics Indonesia / Bali: tourism arrivals, occupancy, land-appreciation context, bali.bps.go.id
- Bank Indonesia, Residential Property Price Index: official price-growth data & IDR rate, bi.go.id
- DJP / Ministry of Finance: PBB & transaction taxes, pajak.go.id
- ATR/BPN: land titles (Hak Milik / Hak Sewa / HGB) & zoning, atrbpn.go.id
- Market data (2026): Paradyse Homes price-per-are study (AirDNA-benchmarked); Prestige Property Bali area/yield analysis; Bali Villa Realty price guide; InvestLandBali market report.
- Magnum Estate portfolio data (Uluwatu net yields, ADR & occupancy by project): based on [N] units, [period]. [add methodology]
About the author
Donny Yosua is a market analyst at Magnum Estate, an award-winning Bali developer (Berawa, Sanur, Sky Stars, Sky Royal). He tracks Bali pricing, yields and regulation for foreign investors.